Do you know which DP-pool will fill-up next?
Keeping an eye on the status of each dynamic-provisioning (DP) pool is crucial but a daunting task as well. IOportal offers a detailed view of each DP-pool, along with a graphics that illustrates the evolution of the pool during the past year as well as a prediction for the next six months. But what about a condensed pool status view over all pools across all storage arrays, where all important information is available at a glance?
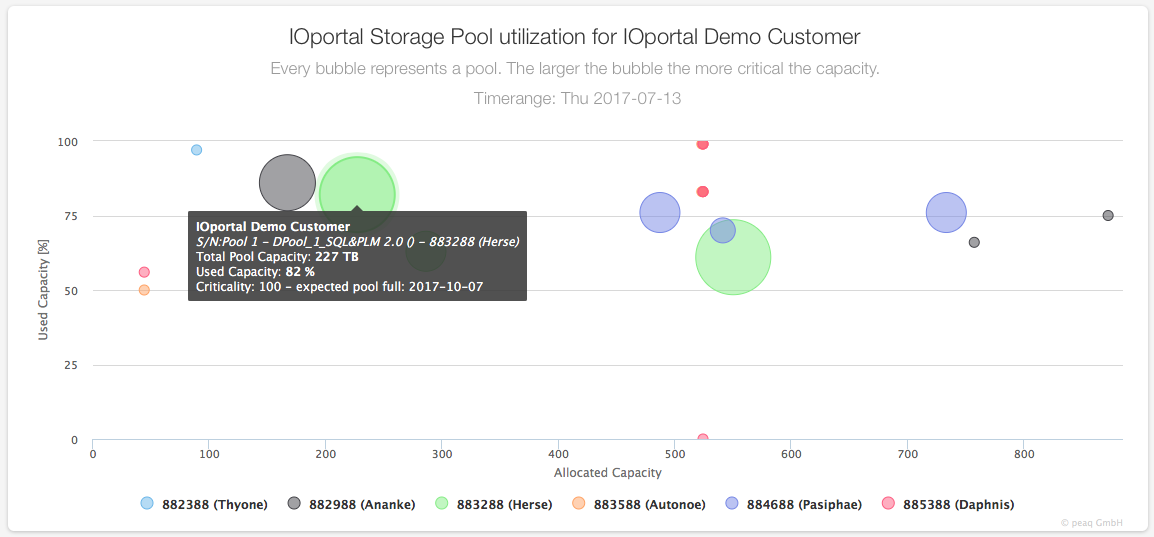
New DP-pool bubble chart in IOportal Cockpit
Look no further: the new DP-pool bubble chart in IOportal Cockpit brings together the most important DP-pool information in one single chart! Each bubble represents one DP-pool whereas the color of the bubble indicates the storage array. The horizontal position of a bubble represents the allocated pool size. The vertical position represents the percentage of used capacity. Bubbles that are close to the 100% line are almost full. Is this a problem?
Well, it depends. If the pool size is still growing, then maybe. If the pool size is growing fast, then certainly. We capture these dynamics in the size of the bubbles: big bubbles indicate pools that are growing „fast“. How fast is fast?
Actually it does not matter. What matters is how soon we expect the pool to run full. Hence, very big bubbles indicate pools that will run full within 3 months. You want to do something about those. The smaller the bubble size, the longer it takes until the pool runs full.
So in fact it does not matter if a pool is close to 100% full. There may be a new pool lurking with lots of free space, that nevertheless grows rapidly and requires close monitoring. The bubble size is all you need to look at.
So there you are. One chart is all it takes to be the master of your DP-pools.


