New IOportal release - meet the Cockpit
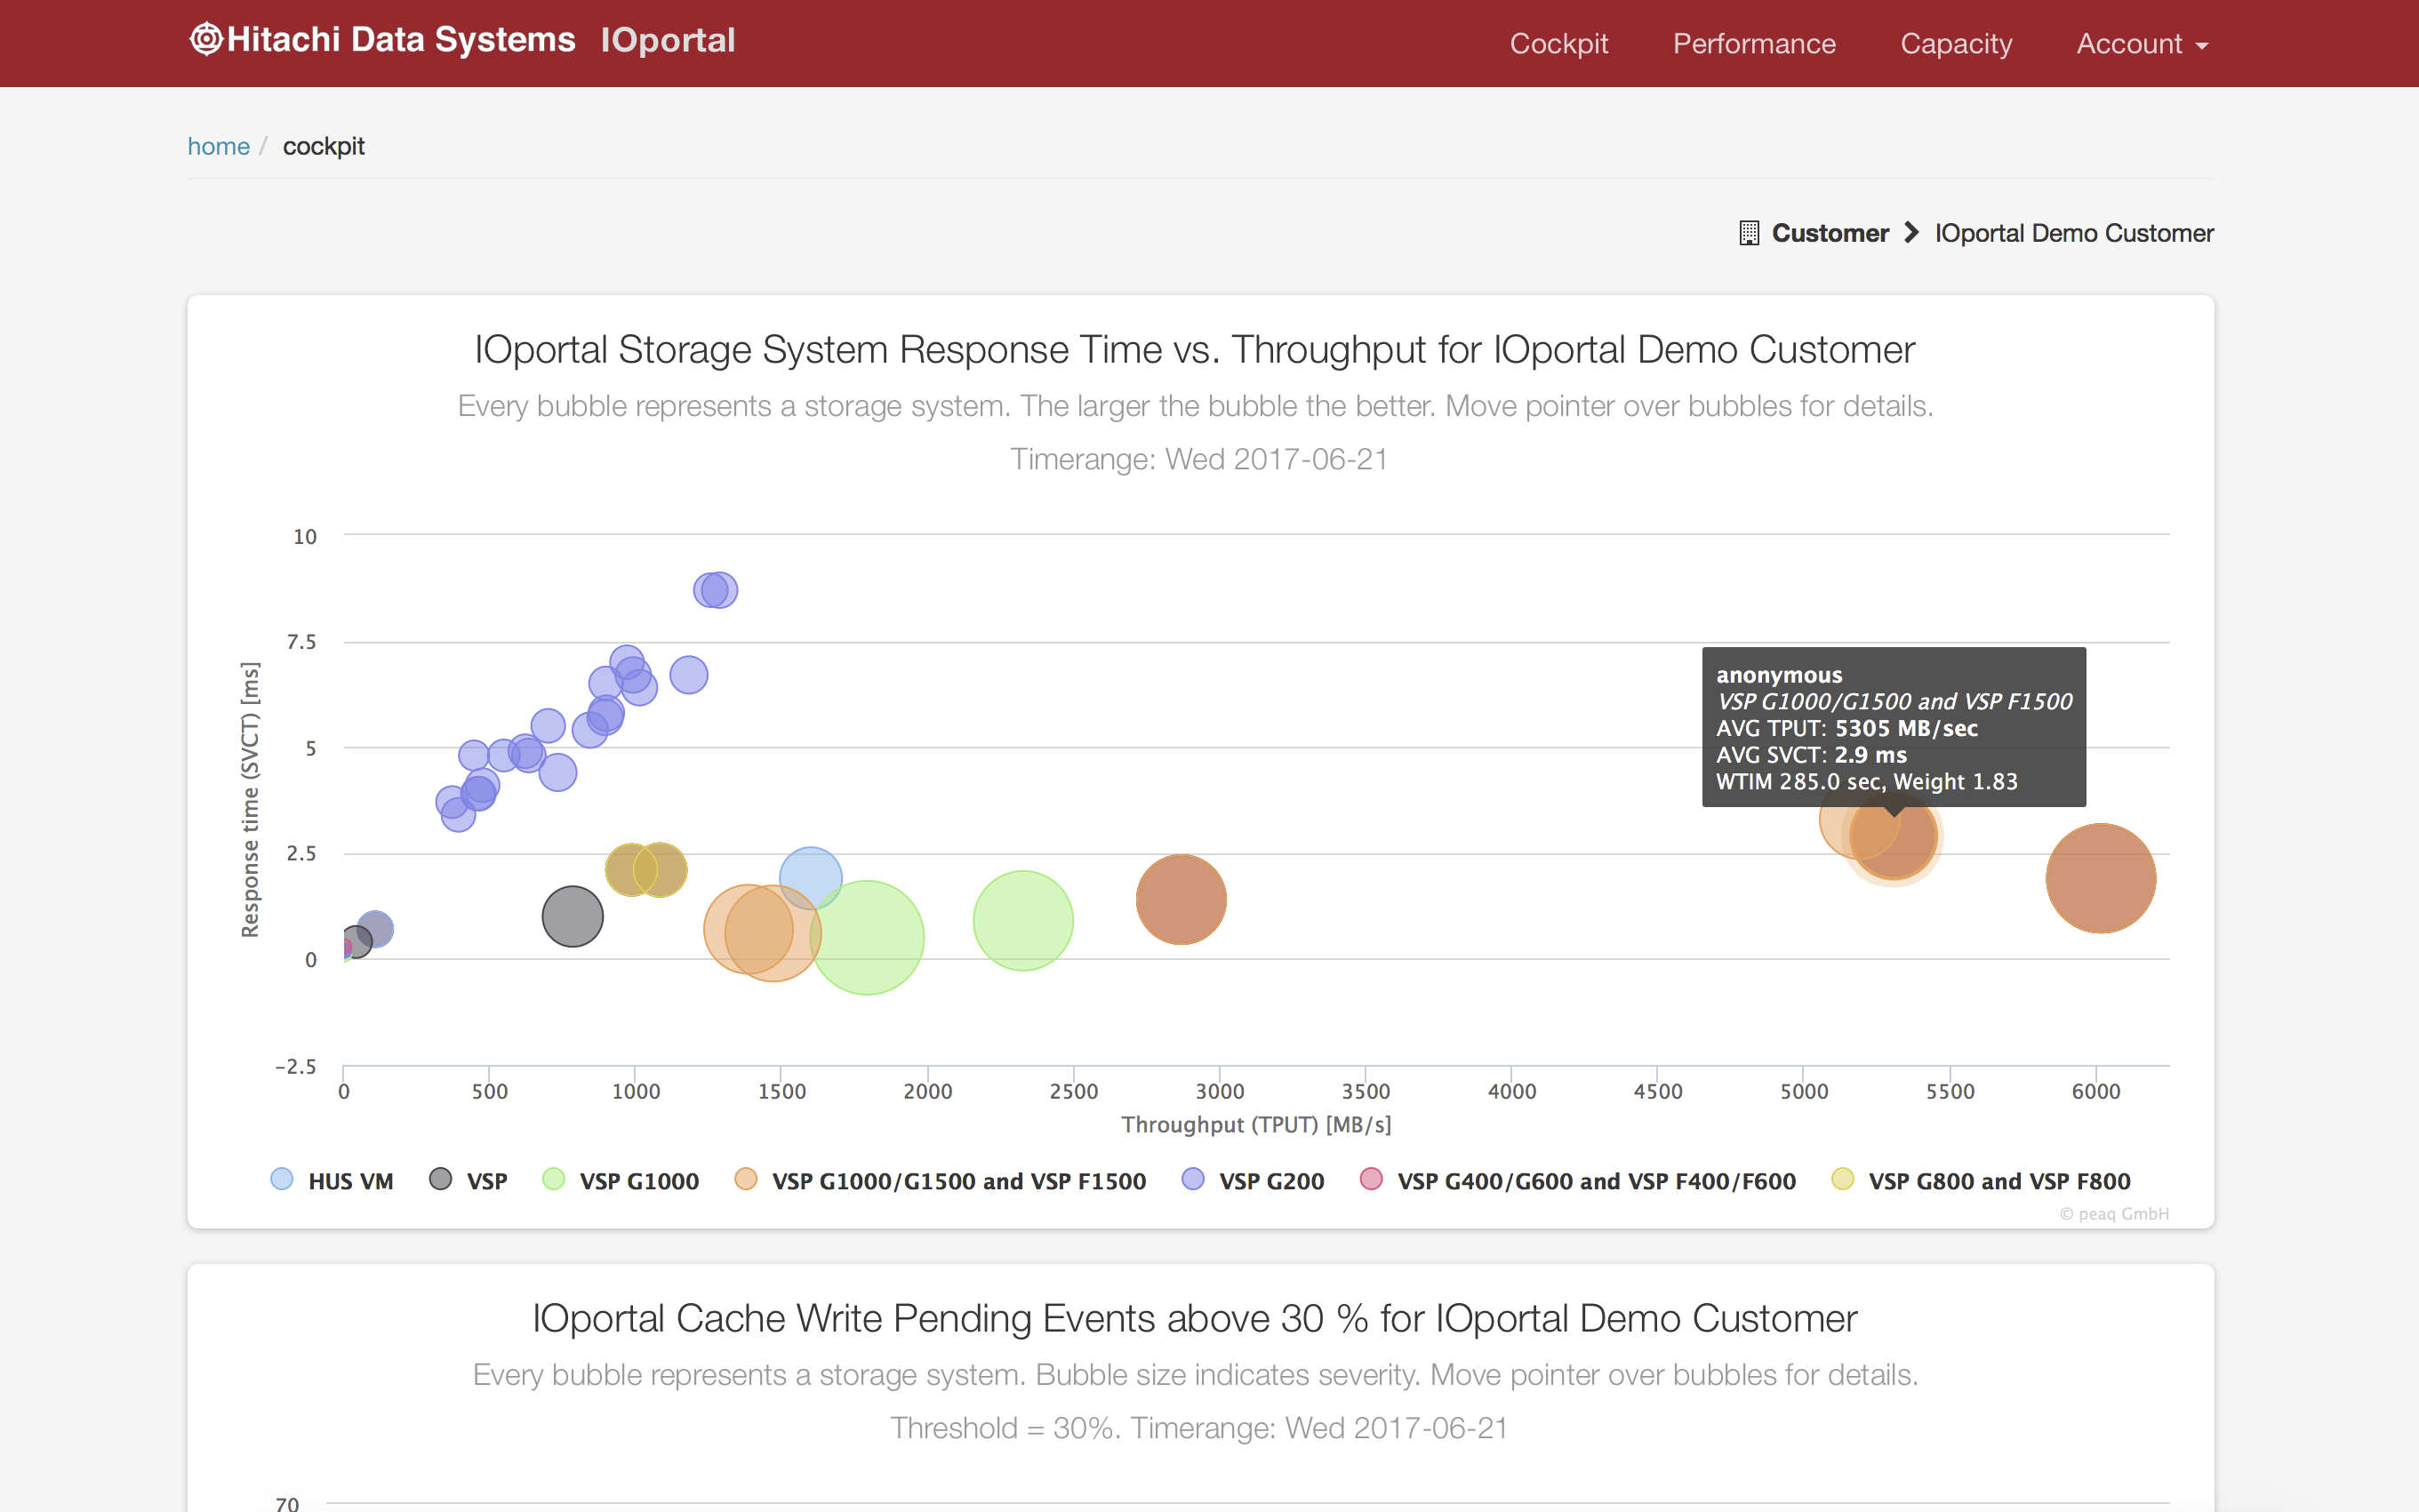
IOportal customers can now benefit from the “Cockpit” graphics. The new bubble-chart graphics represent various threshold violations across cache, crossbar, parity groups, multiprocessors, ports and servers that occurred during the last day. The IOportal user can identify at a glance which resources can potentially lead to performance issues and require closer monitoring and/or investigation.
Furthermore, each IOportal customer can compare the performance of his storage arrays with the array performance of all other IOportal customers. This comparison highlights the common performance profile of various HDS array models based on real world data from actual production installations. All customer-identifying data are anonymised for this cross-customer graphic.
Learn more about the new IOportal Cockpit functionality in the IOportal user guide!


