IOportal Service
See where your storage is heading.
IOportal is a cloud service that turns your Hitachi storage into reports you can rely on: deep enough to answer the real question, drawn from the same readings Hitachi engineers use. What you see holds up.
- See which server or application is causing the load, and address the real cause.
- See your storage's whole lifecycle, with the biggest consumers ranked for you.
- Benchmark your systems against other real Hitachi systems. A new perspective on performance.
Your numbers, made readable
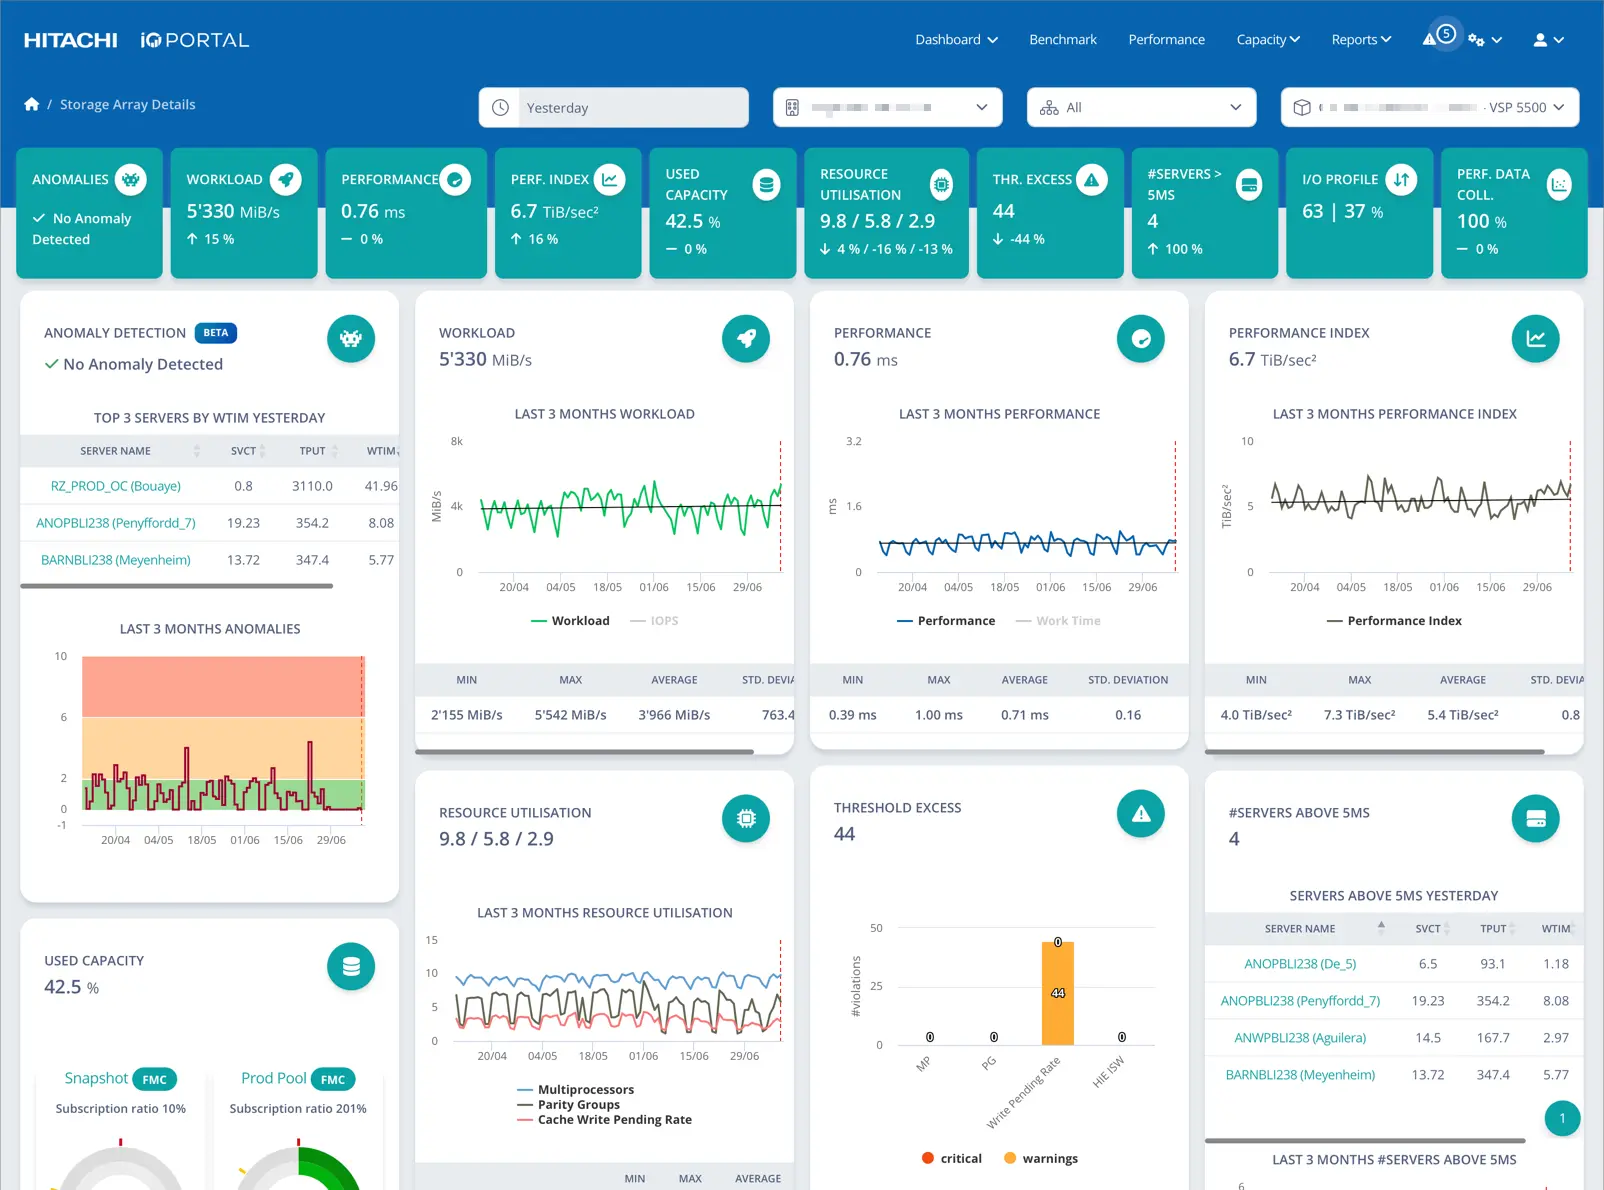 The system on one screen
Workload, performance, capacity and thresholds side by side, with three months of history and the top servers already surfaced. The full picture, all at once.
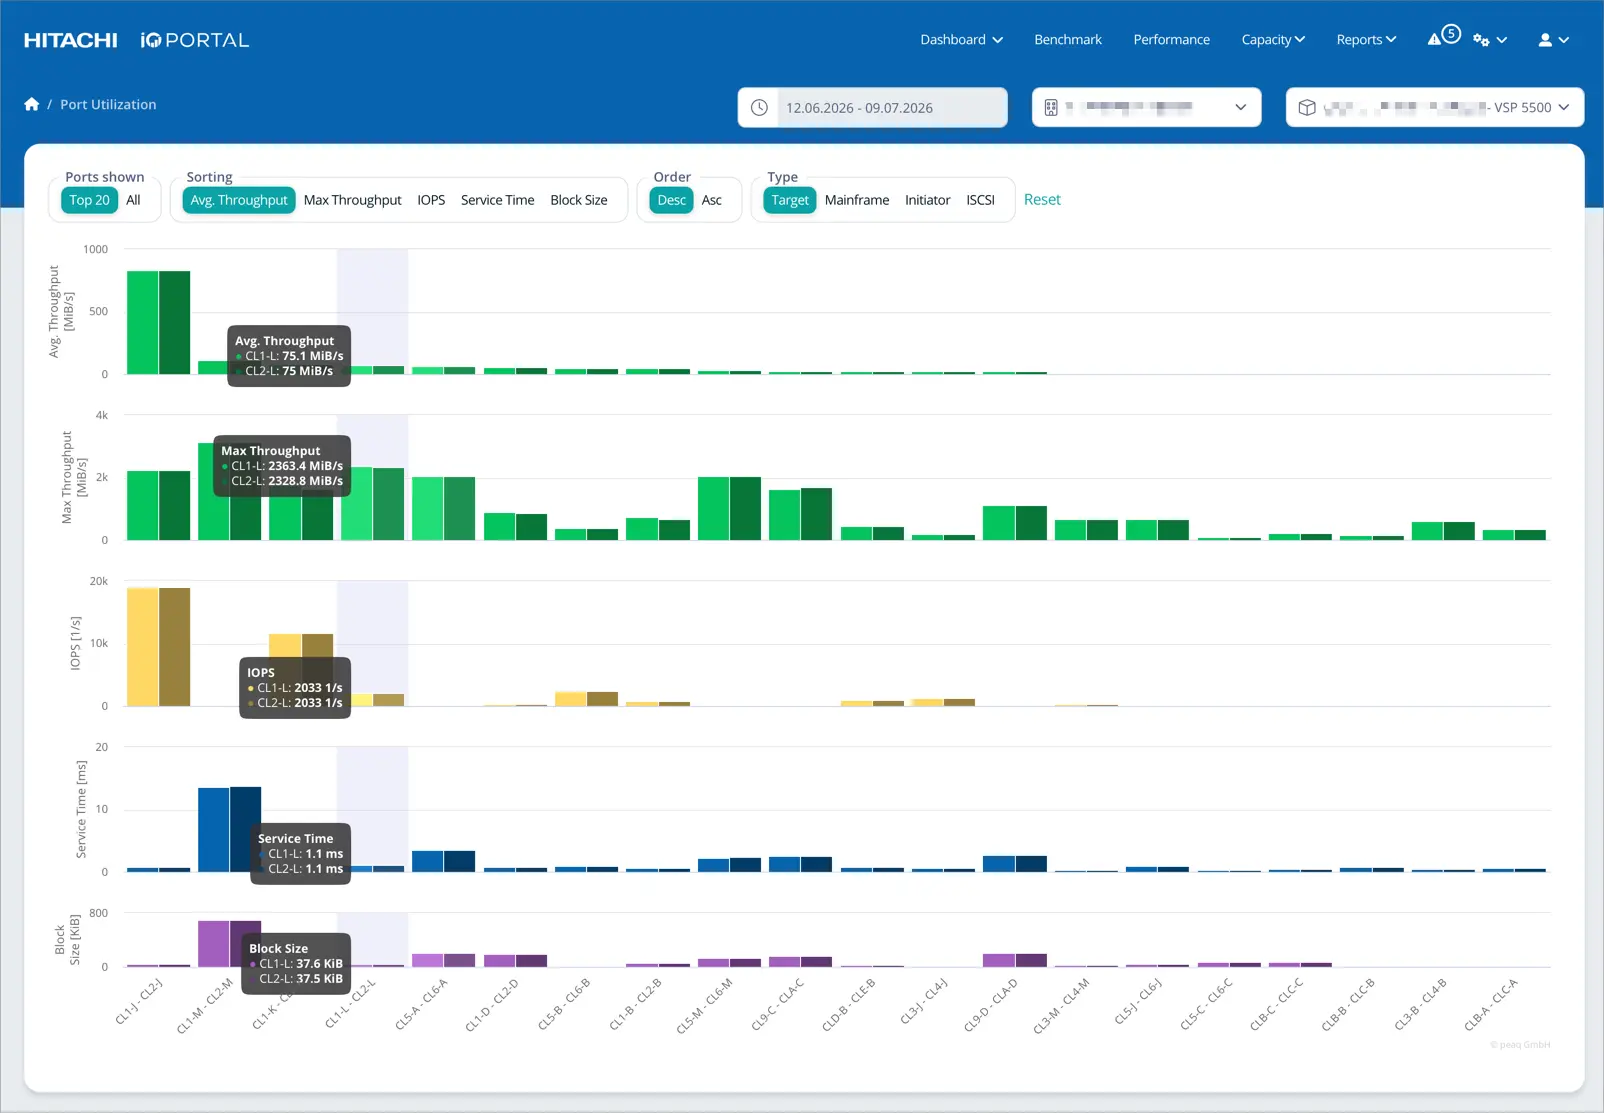 Find what is driving the load
Every port ranked by throughput, IOPS and service time, so the resource driving the load sits right at the top instead of buried.
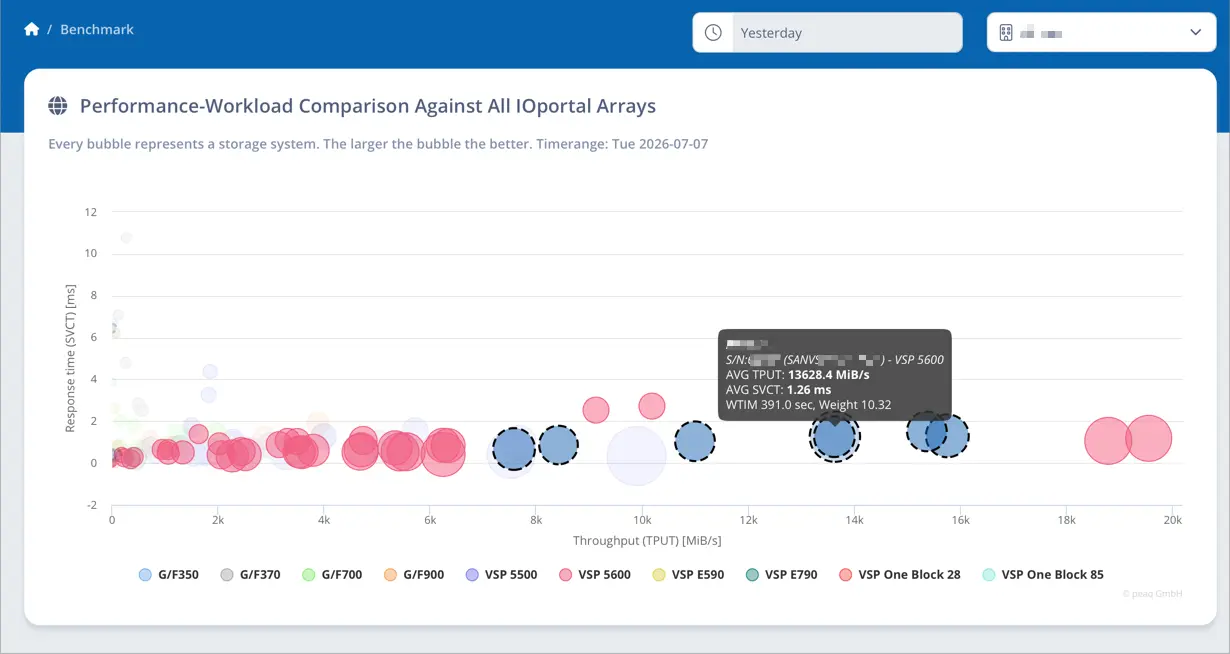 Where you stand
Every storage system on one chart, yours highlighted. One look shows how you compare to systems like yours.
Answers, not just numbers
Most storage reporting stops at a figure that looks fine. IOportal takes it to where it becomes an answer: deep enough to find the cause, and far enough ahead to act before something turns into a problem.
Every pool gets a real projection of where its capacity is heading months ahead, with a confidence range around it, so you plan the next expansion before a pool runs short rather than after.
Simple deployment. Secure upload. Cloud insights.
- 01It all starts on a server inside your own network.
- 02From there, everything travels to the cloud over an encrypted connection.
- 03In the cloud, it becomes graphs you open from any browser.
See it in Action
Real screens from IOportal. Click through and see what working with it actually looks like.
- Overview
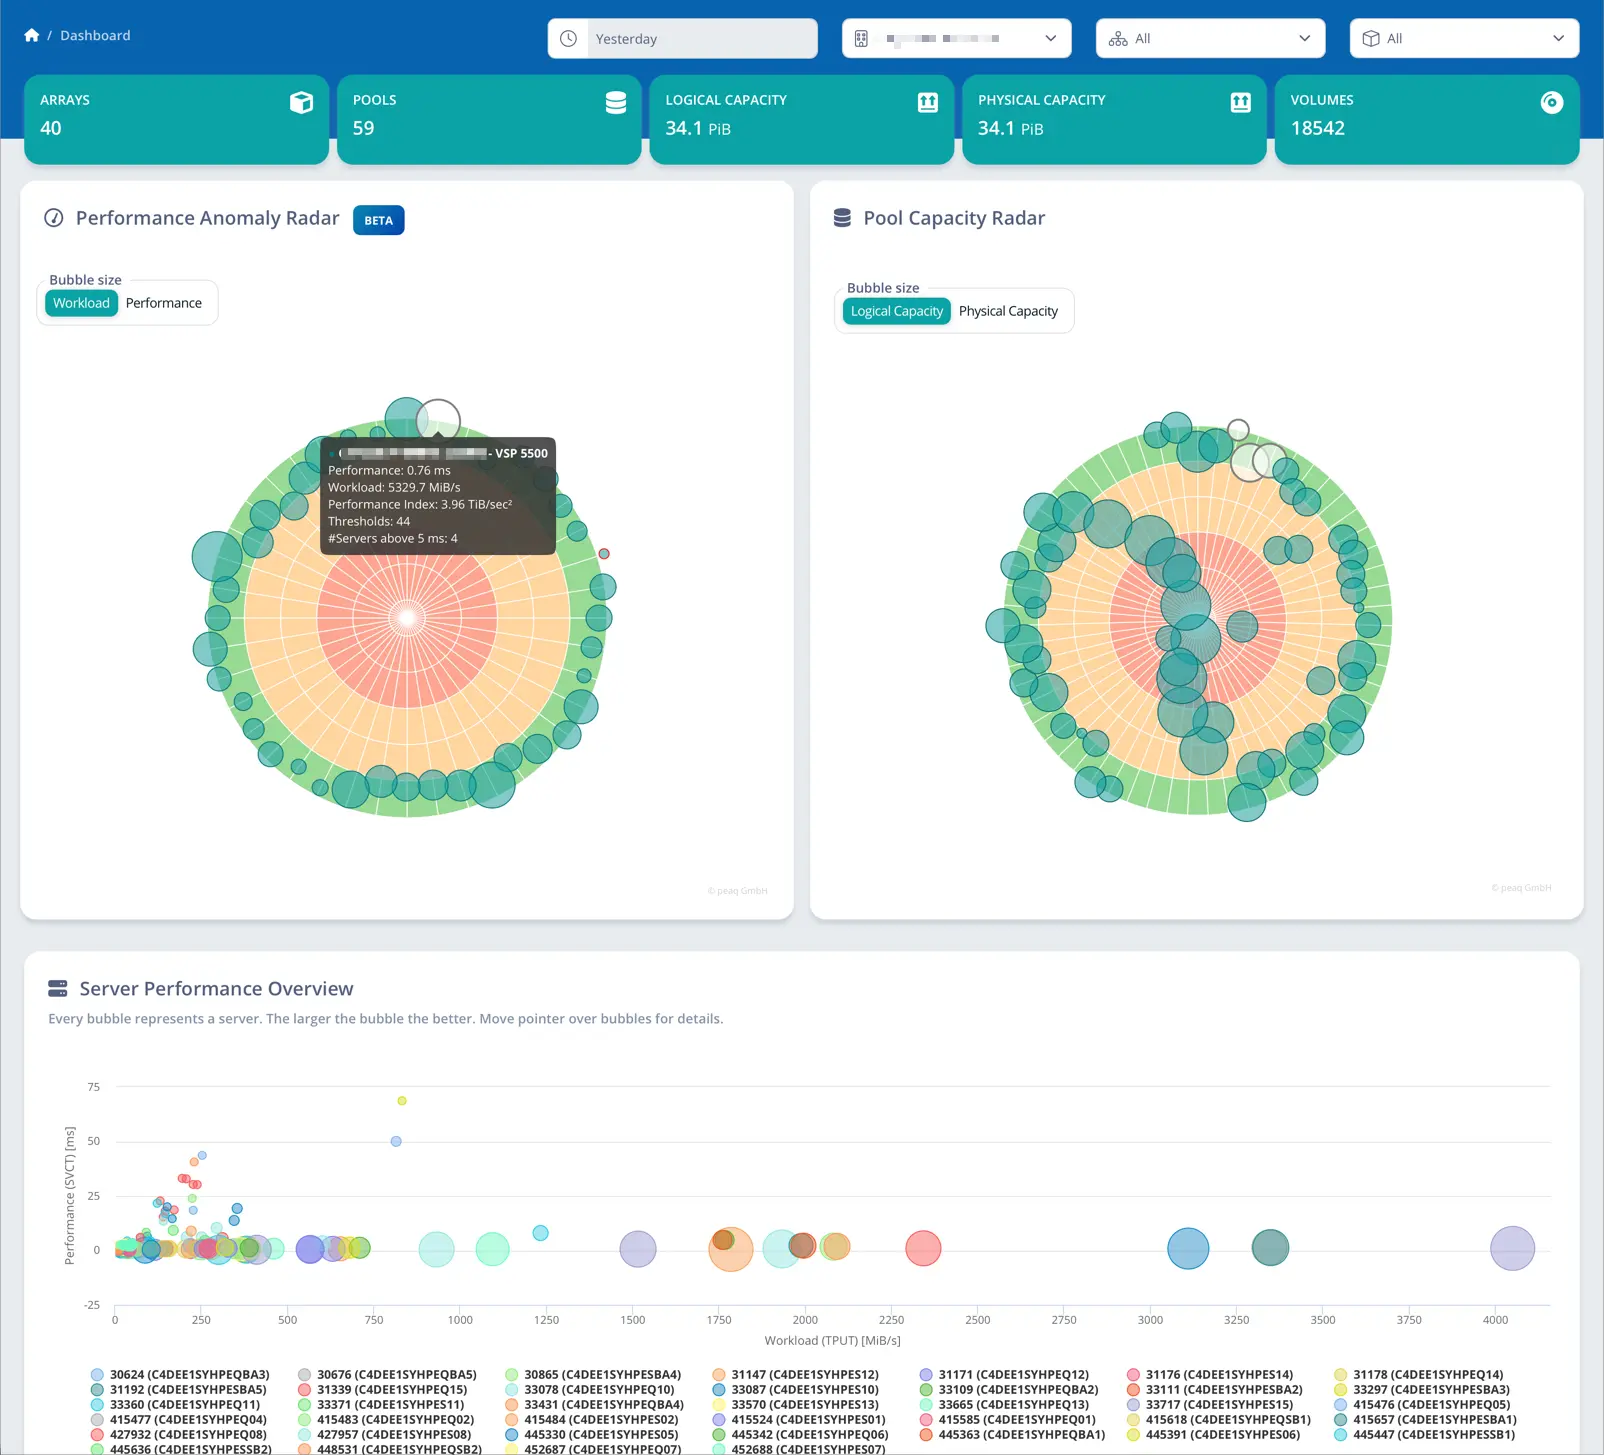
The page you land on: did any array show an anomaly yesterday? One look answers it, and every deeper view starts from here.
- Array Details
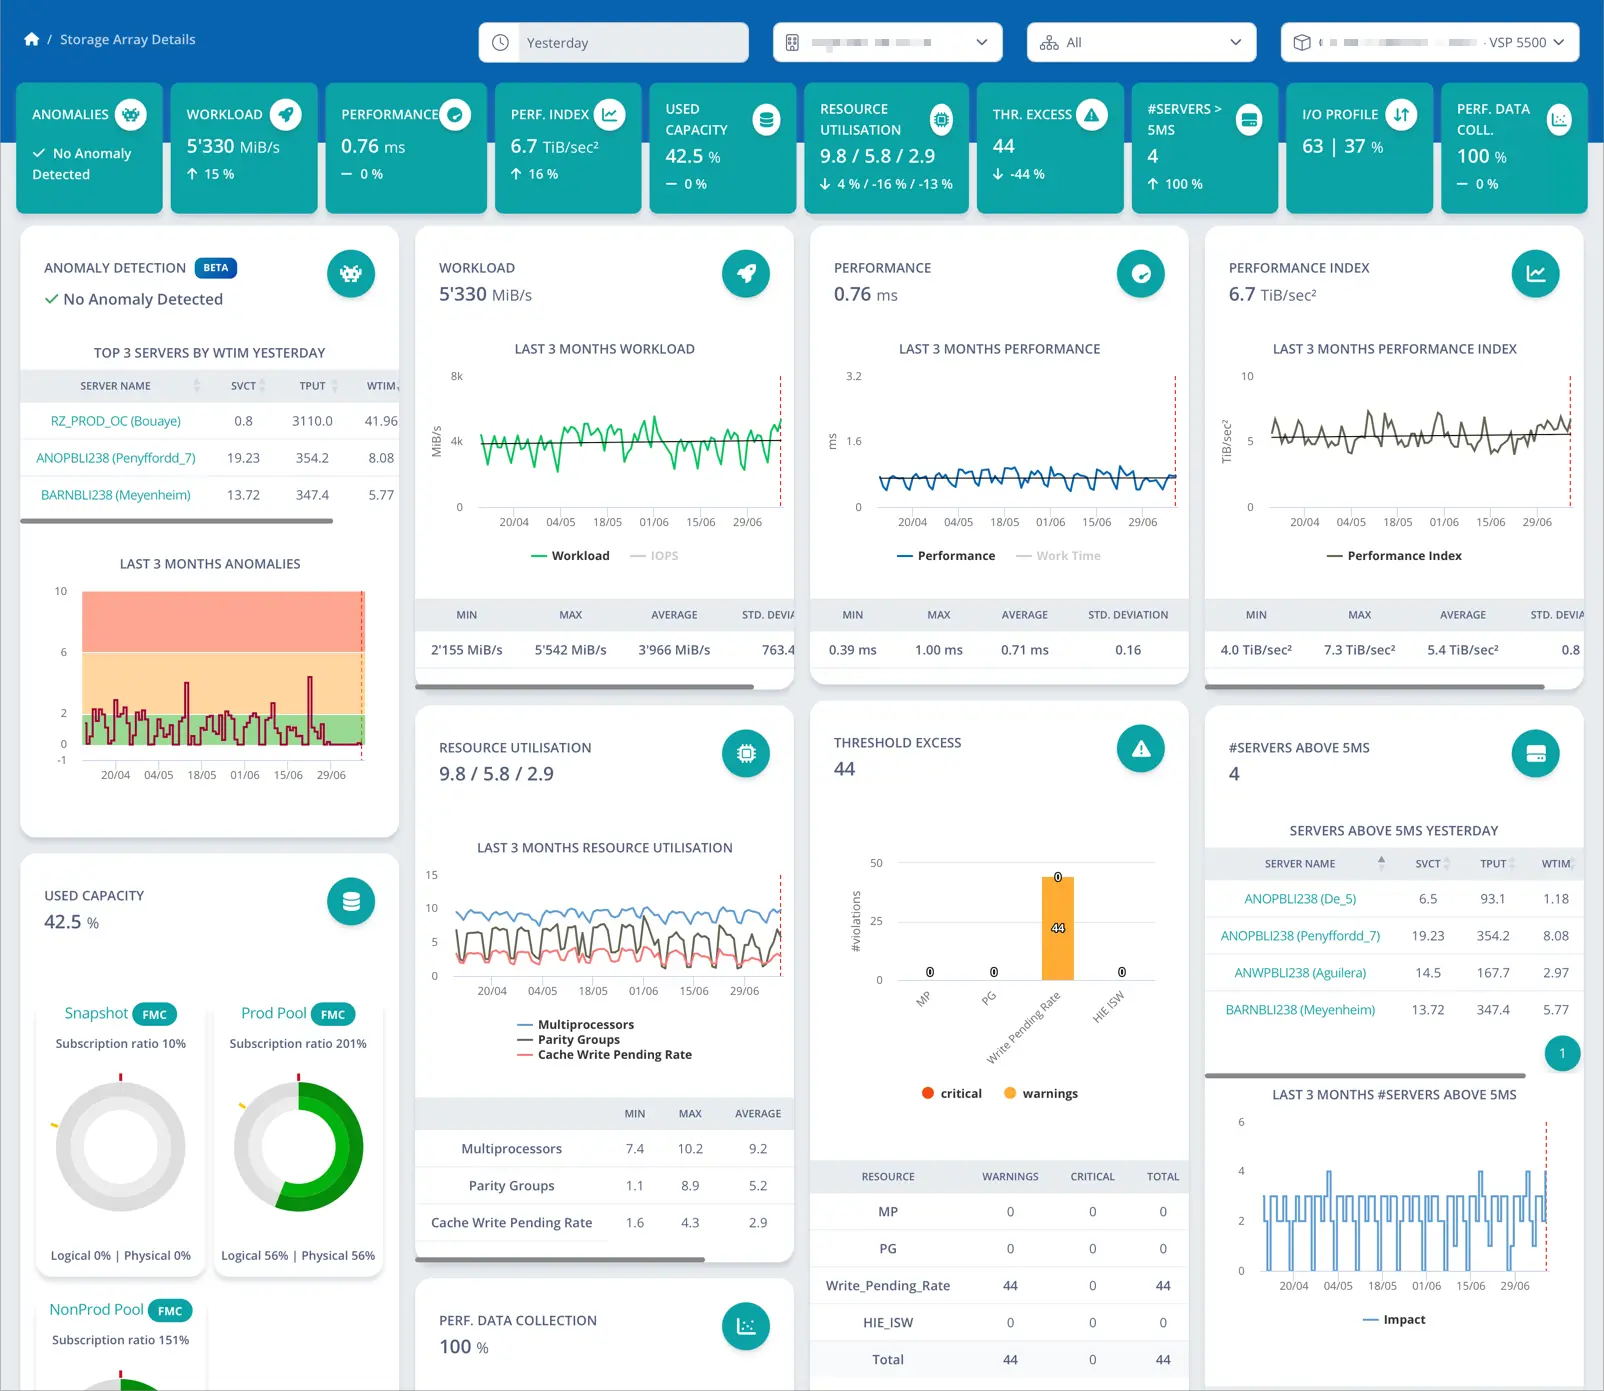
One array in full depth: every KPI, its three-month trend, the top servers and thresholds, on a single page.
- KPI Trends
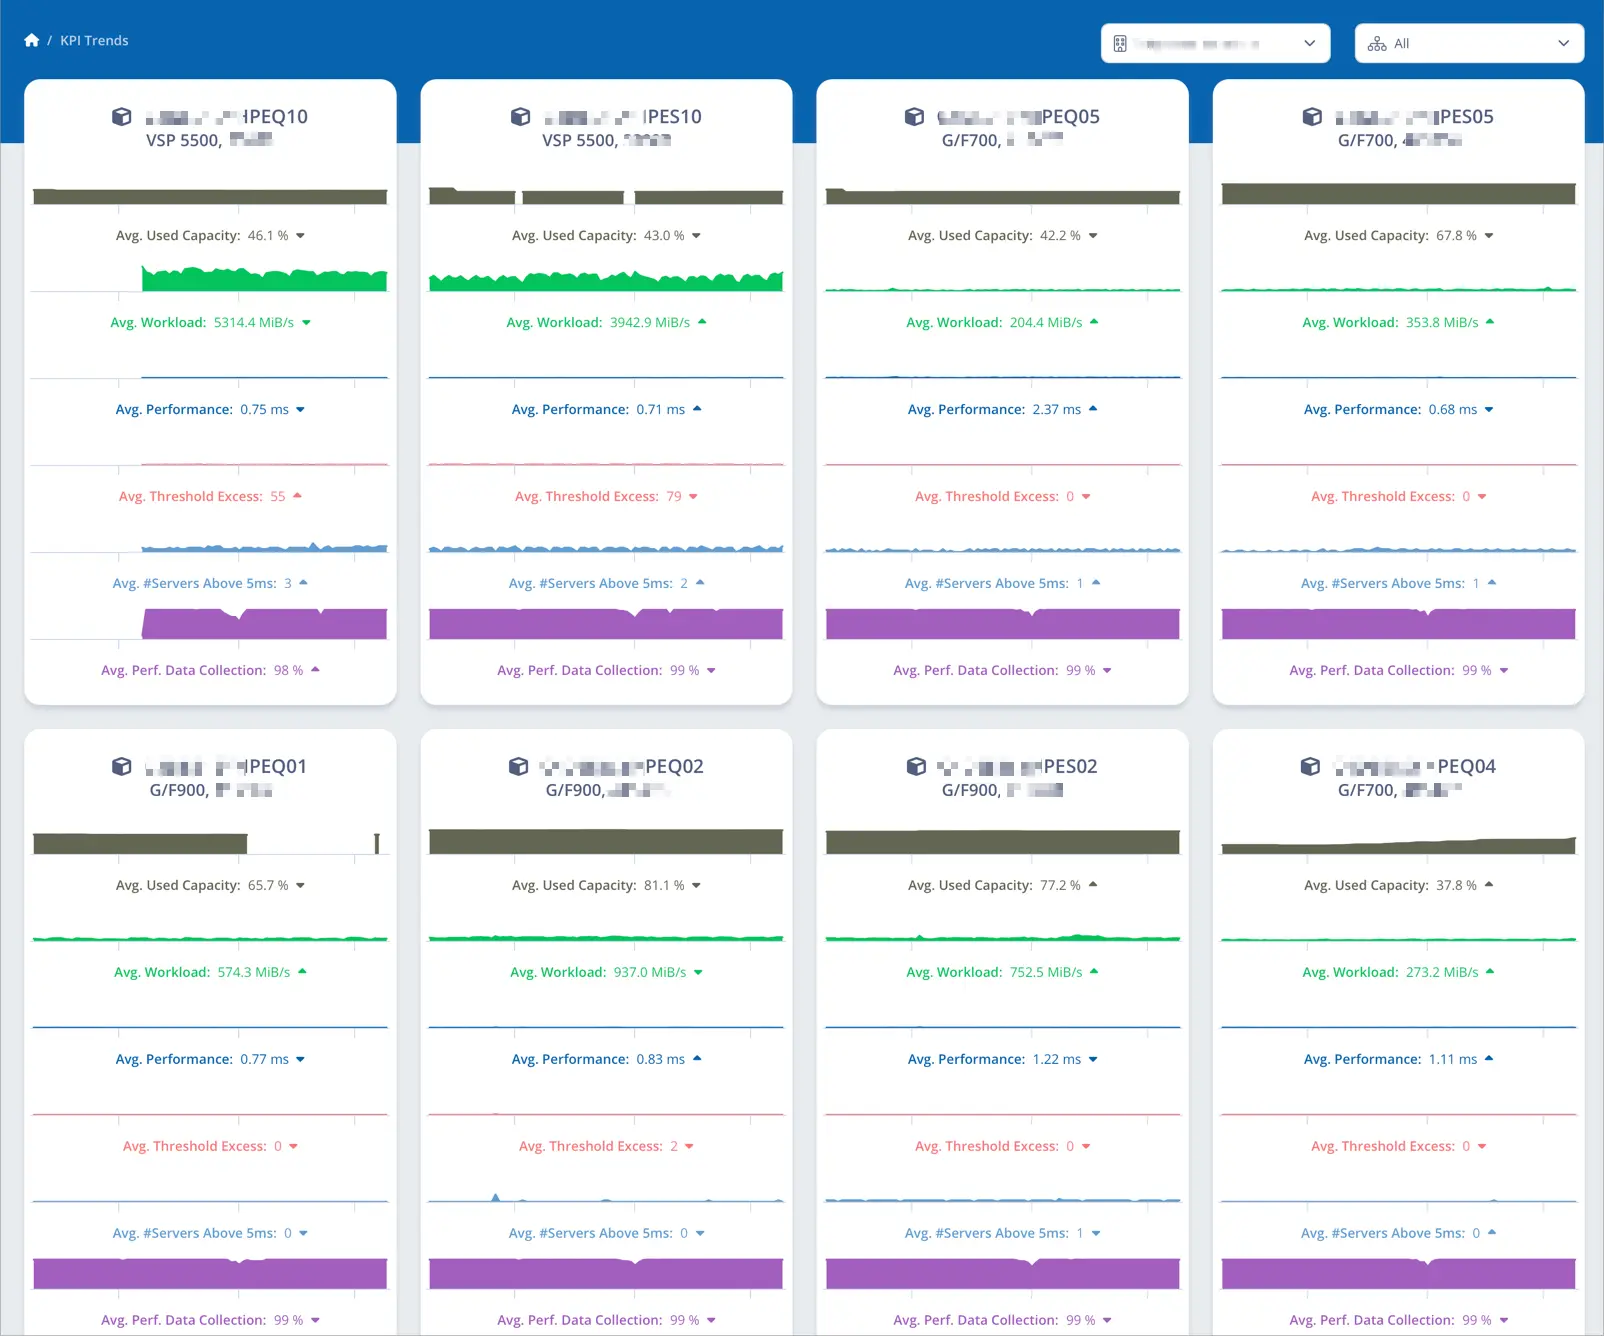
The key figures for every array side by side, each with its trend, so you can see what is moving before it becomes a problem.
- Performance
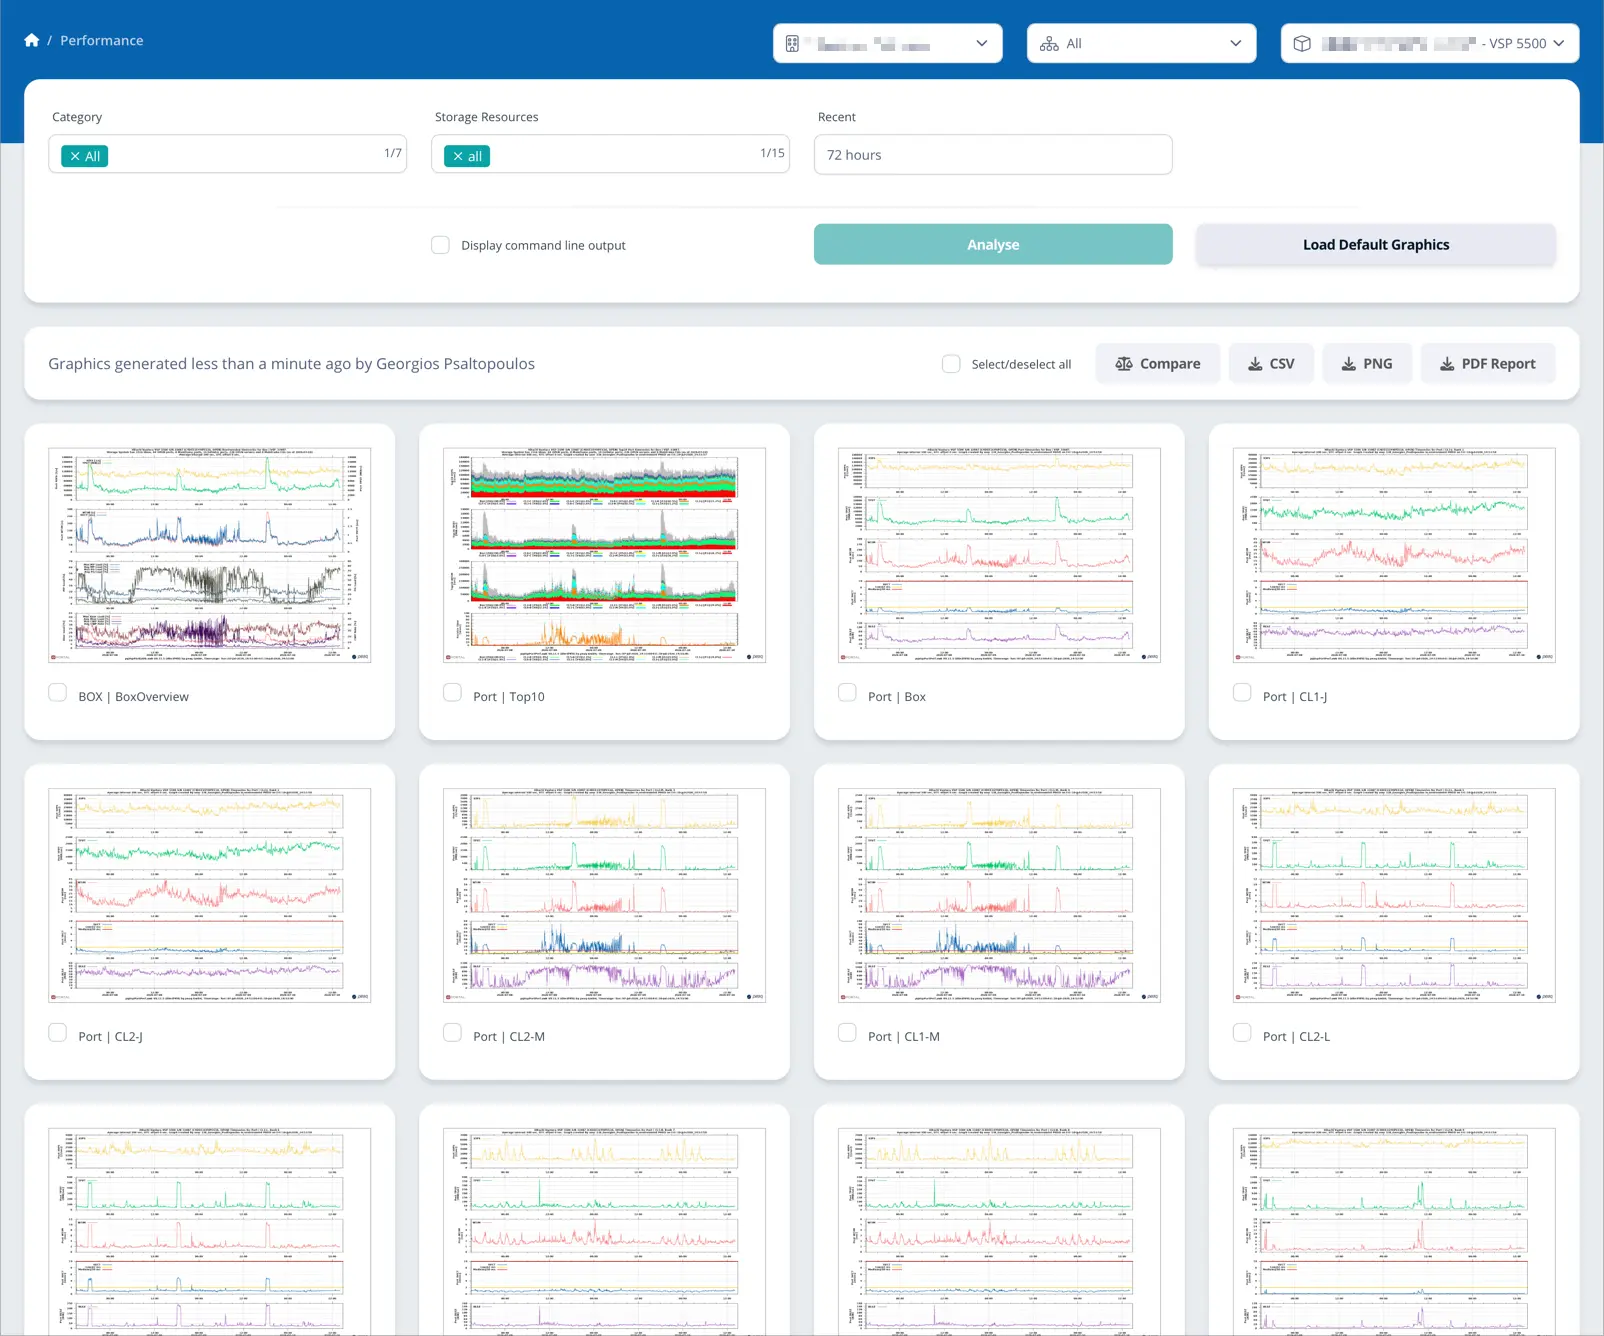
Generate detailed performance graphs for any resource and timerange, down to the single port, and export them as PDF or CSV.
- Cluster Report
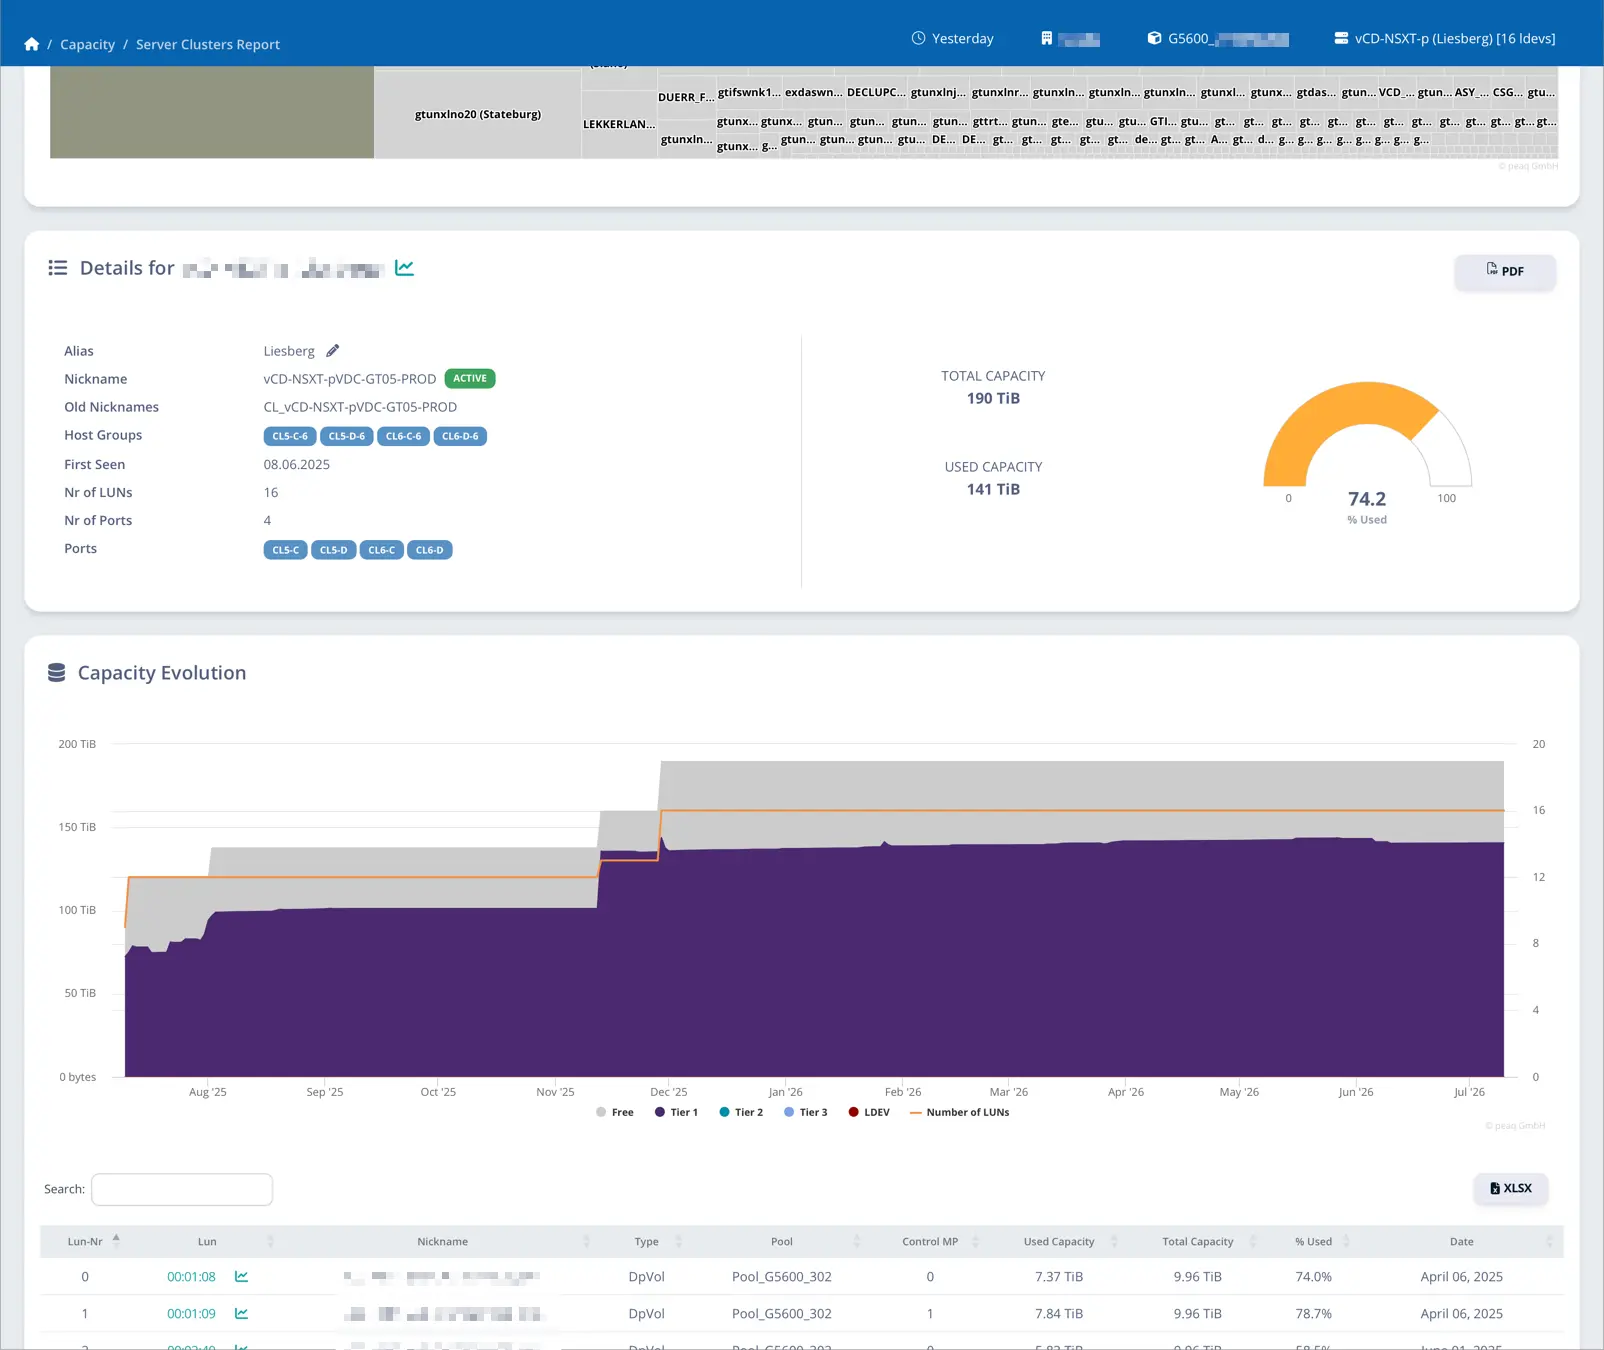
Capacity for a server cluster down to each mapped volume, with a full year of growth, so you see exactly where your storage goes.
- Pool Capacity
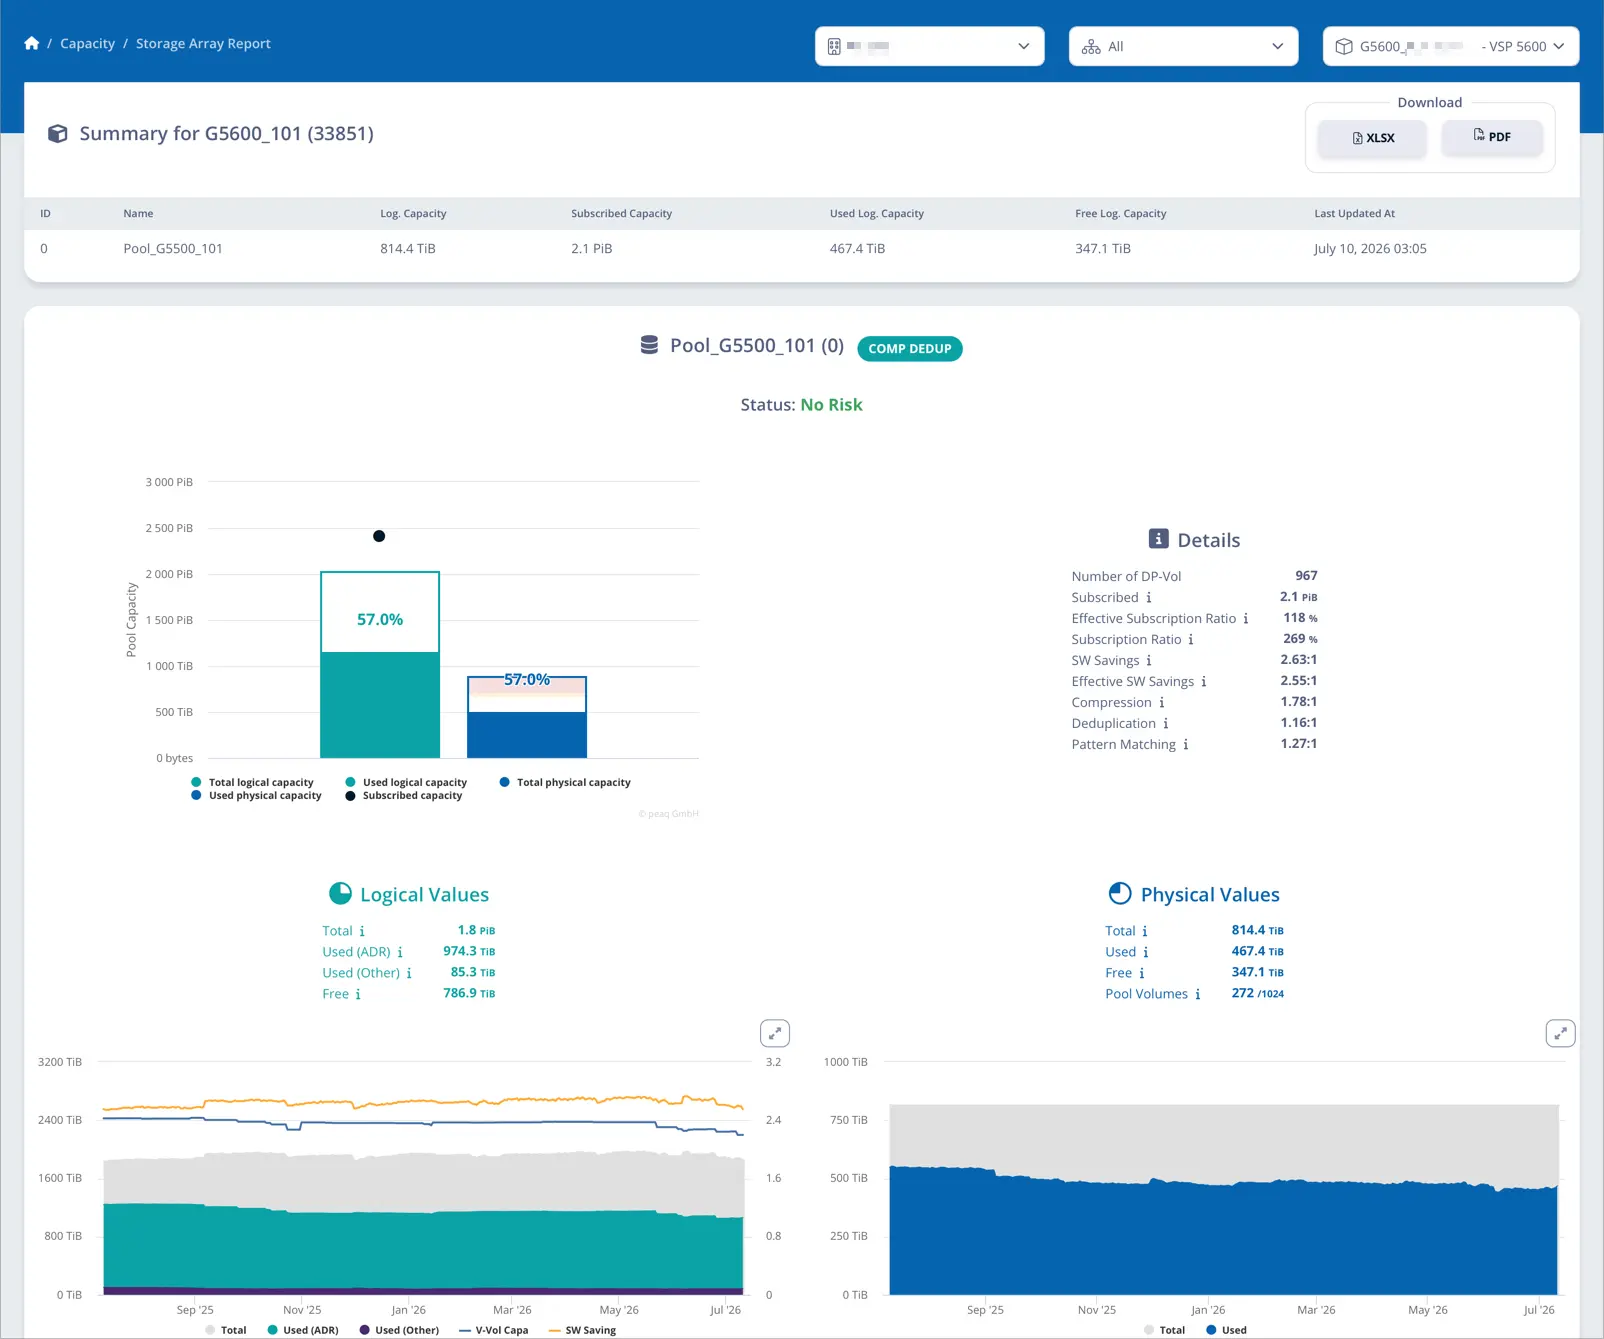
How full each pool is, how much you save through compression and dedup, and whether a pool is heading toward trouble.
We run it. You use it.
Getting started is light: with a small buffer server on your side, we connect your Hitachi systems and set the service up for your environment. From then on we run it and keep it current, and you just open the browser and read.
- Connected, the work is ours
You provide a small server as an upload buffer, and we do the rest: connect your Hitachi systems and set the service up for your environment, so the reporting is there from the first day.
- Kept running, kept current
From then on we run the service and keep it up to date as your estate changes, and we stay reachable when a question comes up, so you never carry the operation yourself.