Read More
New IOportal Release
Precomputed performance graphics save you even more time while troubleshooting.
peaq GmbH
Analytics & automation
Stay up to date!
Precomputed performance graphics save you even more time while troubleshooting.

The Hitachi IOportal is now available with a complete disaster recovery solution that guarantees our customers unfettered access to the IOportal service even in a disaster scenario.
The IOportal REST API offers the possibility to retrieve crucial dynamical information about your storage systems via commands executed in the background fully automatically and in regular intervals.
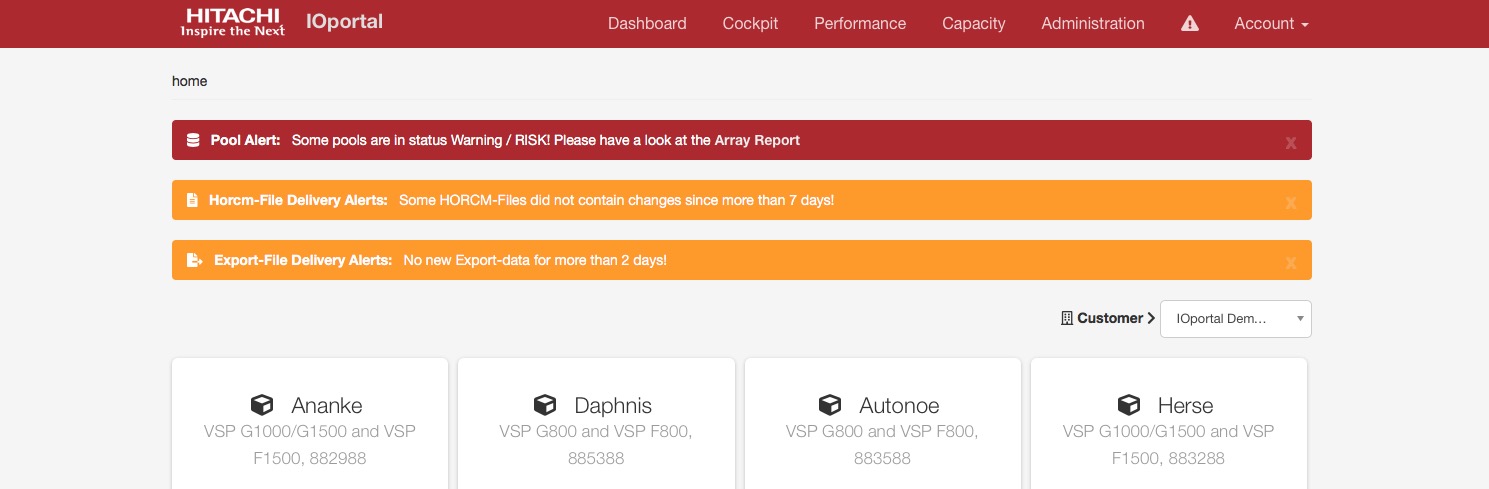
The new alerting functionality informs the IOportal user of all significant events as soon as the user logs in.
The new version has some long awaited features like tenant capability and deletion of host groups. Thanks to the integration of Elasticsearch it is now possible to efficiently search across all executed tasks.

We have a self developed and well established deployment procedure for all of our shell, awk and python scripts. So far we didn’t have any issues with it. So why bother replacing it with Capistrano?
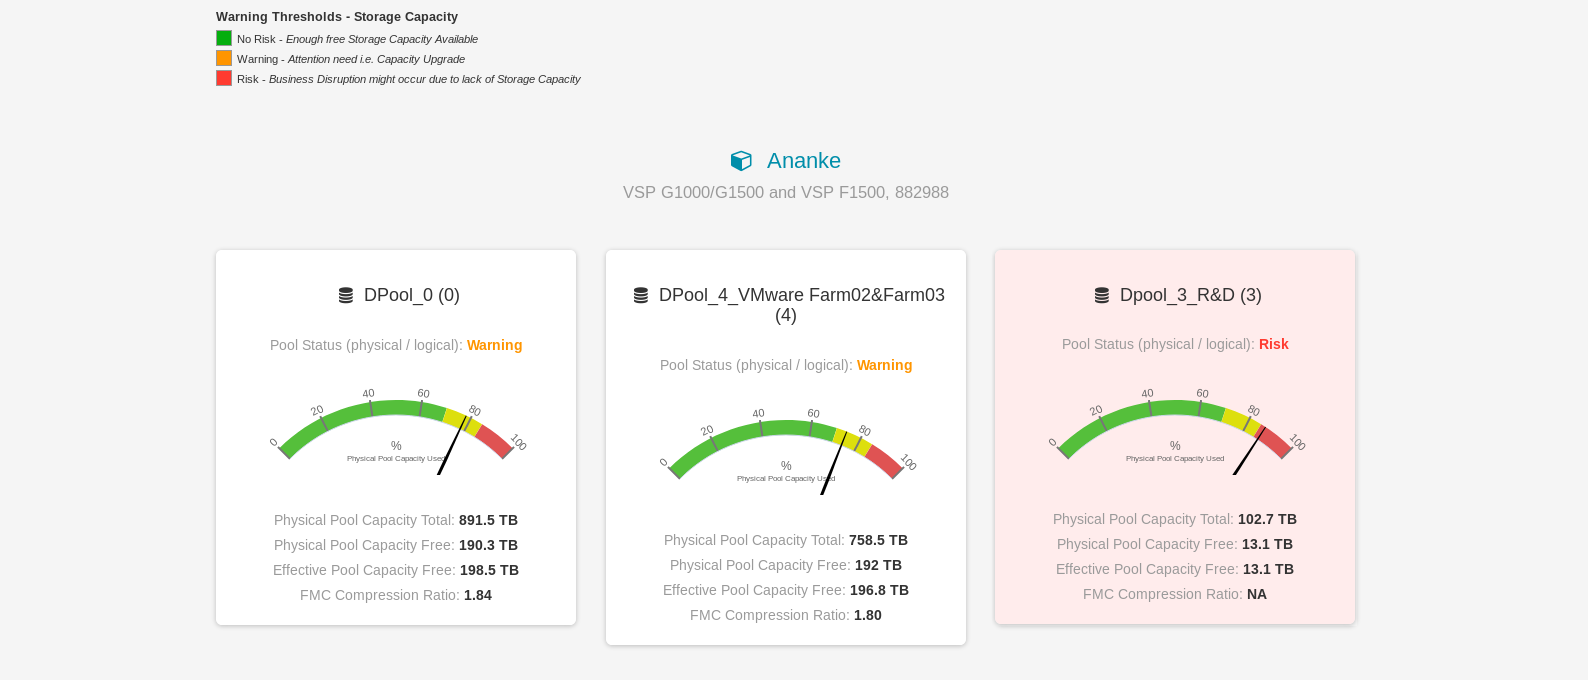
Our major redesign of the IOportal Capacity view takes the functionality to the next level, allowing the user to immediately identify the pools at risk.
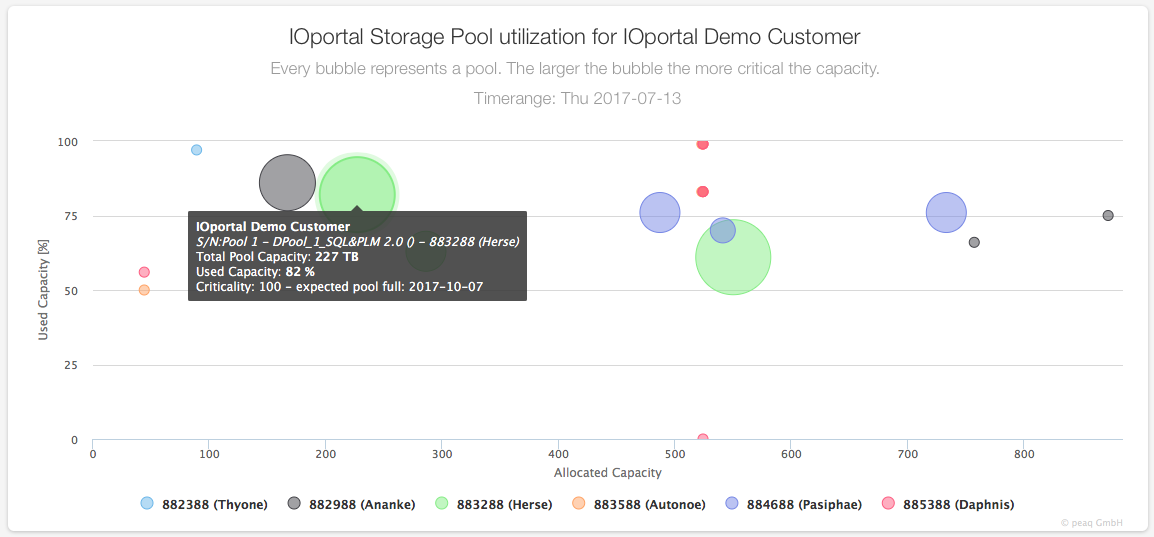
The new DP-pool bubble chart in IOportal Cockpit brings together the most important DP-pool information in one single chart!